Whether you are an owner of a cottage who is considering selling, or a prospective buyer, it is important to be as informed as possible on local market conditions. In my previous career as a managing director at a major Canadian financial institution, I developed a deep appreciation for the importance of sound analytics, and have applied these concepts to glean insights on broader market trends as well as individual property valuation. In an effort to promote greater transparency and efficiency in our local markets, I am pleased to provide statistics and commentary on each of the major lakes in our core service area. If you are interested in a more precise valuation of your property, please contact me at (705) 438-3000 or email me and I would be happy to provide a value estimate at no cost.
~ David Donais, Broker of Record/Owner
2025 Sturgeon Lake Market Value Summary
There were 104 direct waterfront properties listed on MLS on Sturgeon Lake in 2025 and only 44 of these listings sold.
The 44 sales can be divided into two distinct groups in terms of how easy they were to sell:
- 24 sales required no reductions from the original list price and sold quite quickly with a median time on the market of 21 days. The average Sale Price-to-List Price Ratio was 95% on these sales, and the average Sale Price-to-MPAC Assessed Value Ratio was 2.29.
- The remaining 20 sales required one or more price reductions and took much longer to sell with a median time on the market of 114 days. The average Sale Price-to-List Price Ratio was only 79% on these sales, and the average Sale Price-to-MPAC Assessed Value Ratio was lower at 2.11.
The above results combined with the fact that far less than half of the properties listed on Sturgeon Lake in 2025 sold reflects the fact that buyers had plenty of listings to choose from in 2025, and while they were willing to step up with strong offers for competitively priced properties that met their criteria (i.e. usually high quality dwellings and/or waterfront), they demanded steep discounts on lower quality properties.
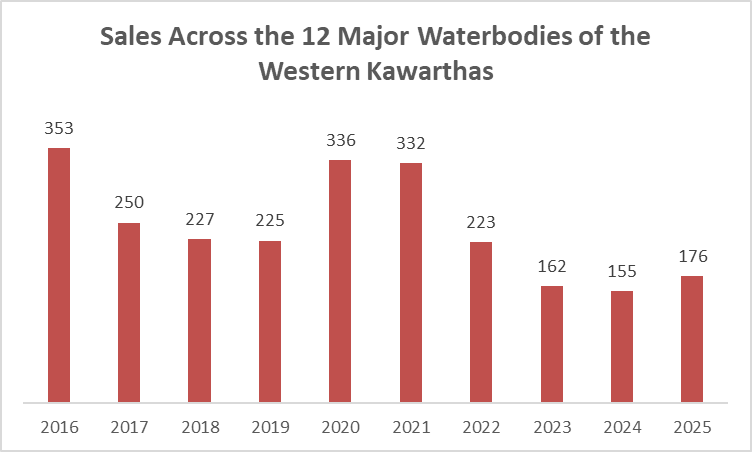
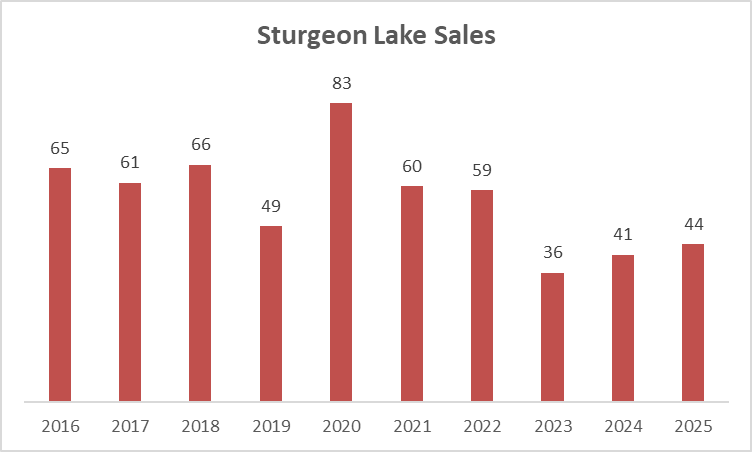
The number of Sturgeon Lake sales in 2025 was up slightly from 2024, consistent with the broader western Kawarthas market, but remained low from a historical perspective.
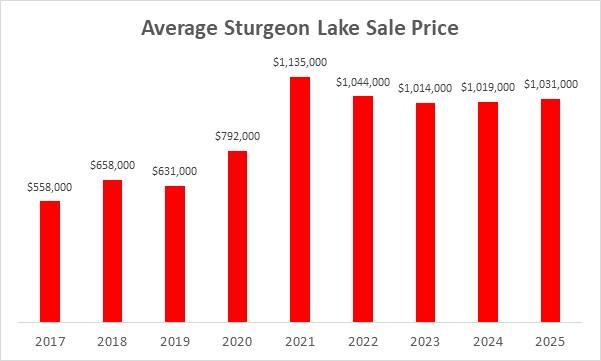
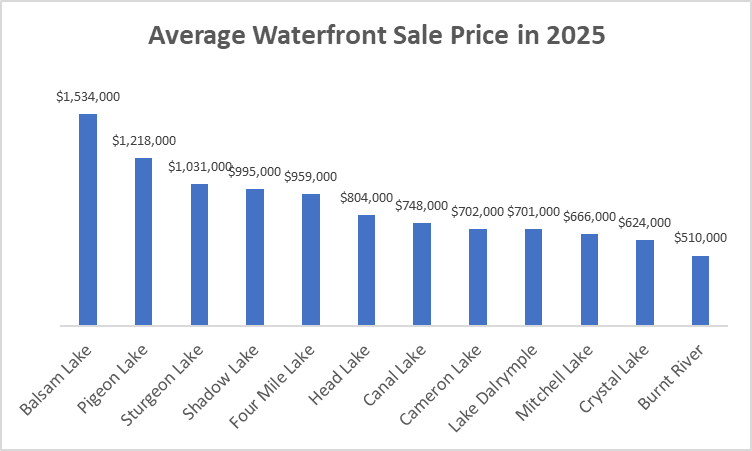
The average Sturgeon Lake sale price of $1,031,000 in 2025 was up slightly from the previous two years and was the third highest among the 12 major waterbodies of the western Kawarthas. The high average sale price on Balsam Lake was influenced by a $5.6 million sale – the average sale price would be $1,279,000 if this sale was excluded.
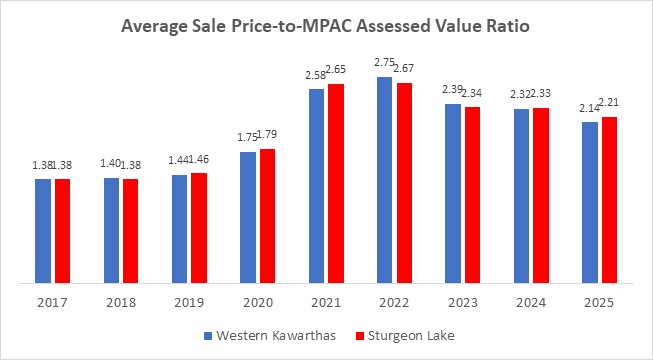
However, the average Sale Price-to-MPAC Assessed Value Ratio of the 44 Sturgeon Lake sales in 2025 of 2.21 was the lowest since 2021, and this trend of falling prices is consistent with that of the broader western Kawarthas waterfront market since the Covid bubble burst in mid-2022.
2024 Sturgeon Lake Market Value Summary
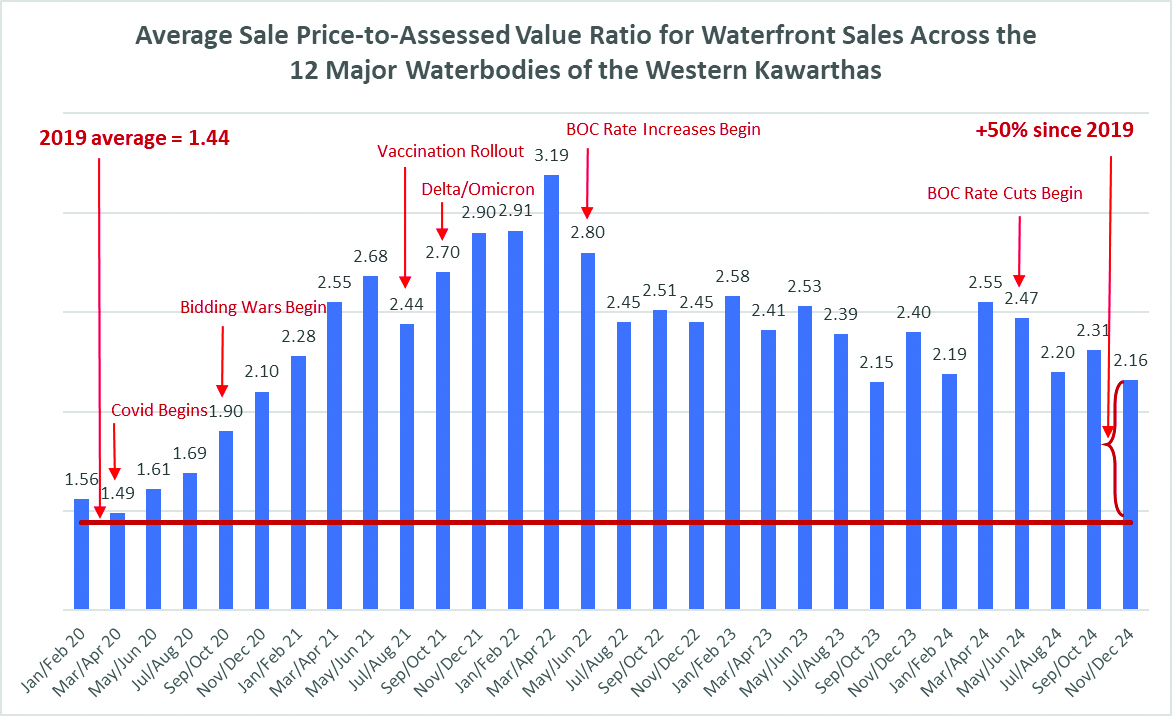
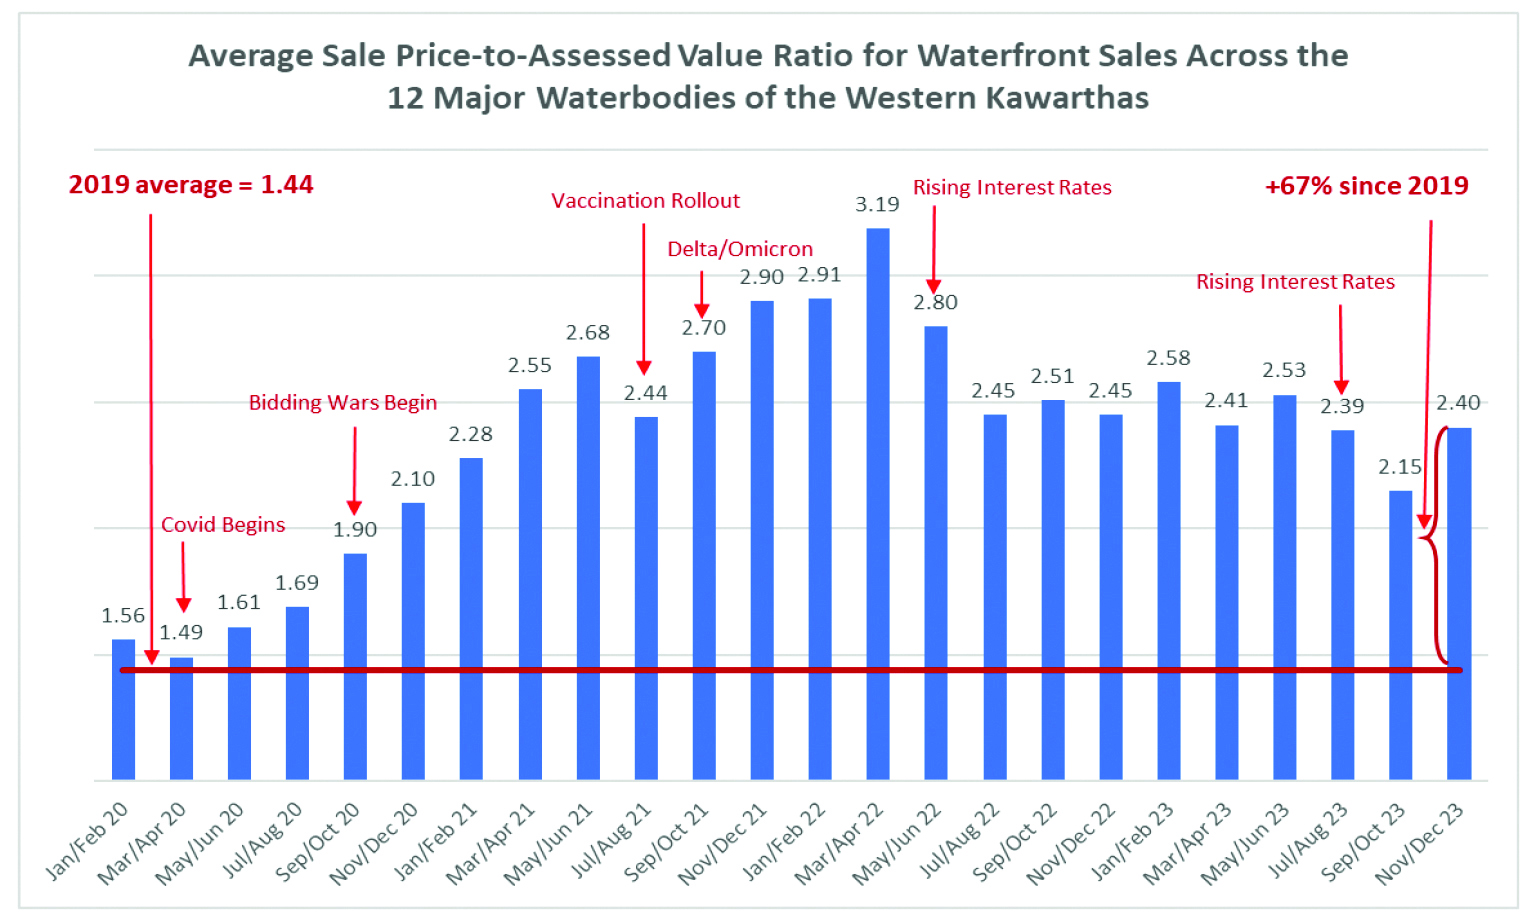
The market for waterfront properties remained very weak throughout 2024, with prices yet to respond positively to the five successive Bank of Canada rate reductions that began in June 2024.
The 12 major western Kawartha waterbodies include Balsam, Cameron, Canal, Crystal, Dalrymple, Four Mile, Head, Mitchell, Pigeon and Sturgeon lakes as well as the Shadow Lake System and the Burnt River.
Sales volumes were also extremely low in 2024, as buyers largely remained on the sidelines.
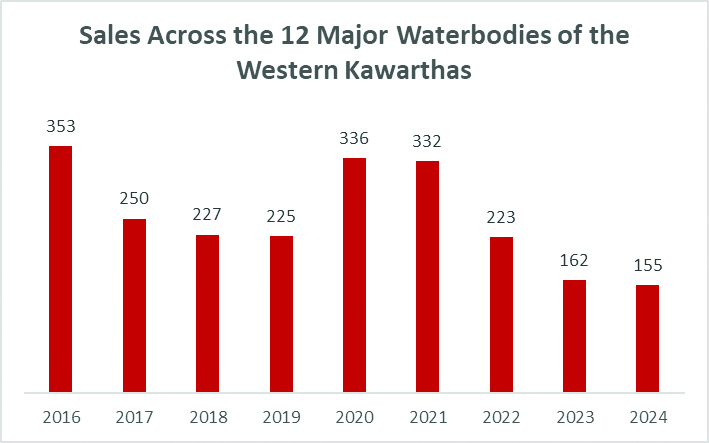
The difficulty in selling waterfront properties in 2024 was further evidenced by the fact that only 44% (155) of the 356 waterfront properties listed across the western Kawarthas in 2024 sold. And almost half (74) of those 155 properties that did sell required one or more price reductions. These 74 sales requiring price reductions were typically on the market for an extended period (median number of days on market of 136 days) and sold for significant discounts to the original list price (18% on average).
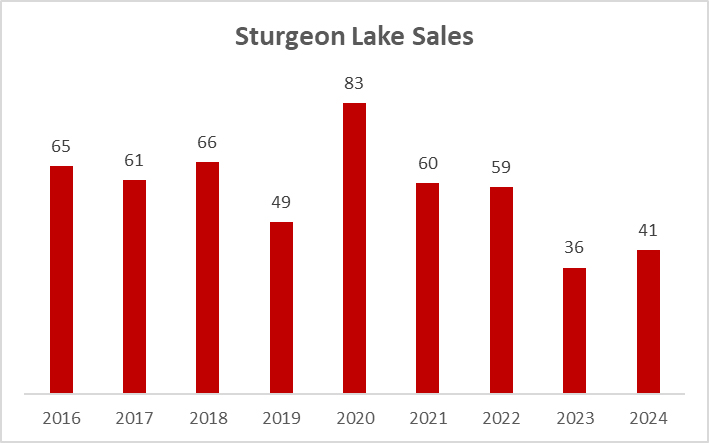
On Sturgeon Lake, 82 cottage properties were listed in 2024 and only 41 sold, with an average discount of 12% off the original asking price. The average sale price was $1,019,000, in-line with $1,014,000 in 2023.
There are some signs of an improved market heading into 2025. 31 percent of the 155 sales in 2024 across the western Kawarthas took place after September 1st – the highest proportion since 2019. We have also been receiving higher volumes of inquiries in recent months from buyers interested in purchasing a waterfront property.
However, any rise in waterfront prices arising from higher demand may be limited by increased listing supply – the unusually low number of sales since the Covid bubble burst in mid-2022 likely means there is a significant overhang of listings poised to come to market at the first sign of improving market conditions.
2023 Sturgeon Lake Market Value Summary
The 12 major western Kawartha waterbodies include Balsam, Cameron, Canal, Crystal, Dalrymple, Four Mile, Head, Mitchell, Pigeon and Sturgeon lakes as well as the Shadow Lake System and the Burnt River.
- The metric I use to track price trends is the Sale Price-to-MPAC Assessed Value Ratio, which is simply the
ratio of the sale price of an individual property to its MPAC assessed value. I calculate this ratio for each
sale recorded, as well as an average ratio for all sales in each time period.
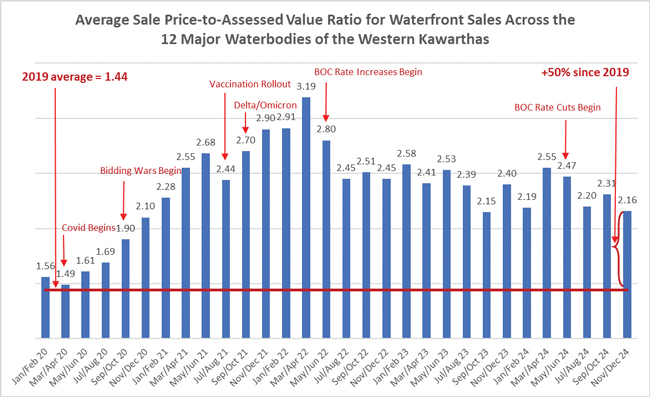
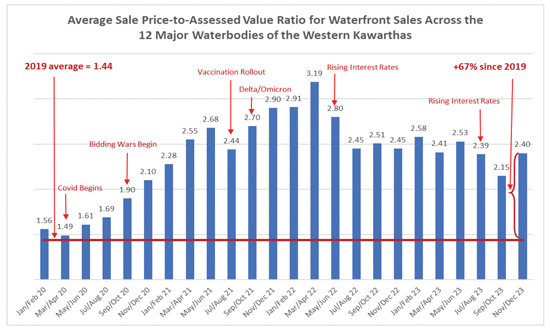
- The chart above summarizes the average Sale Price-to-Assessed Value Ratios for the almost 1,100
waterfront sales across the 12 major waterbodies in the western Kawarthas since January 2020.
This chart effectively tells the story of the pandemic market and its aftermath.
- Prices were choppy in 2023, rising early in the year, falling with the onset of the banking crisis in March,
and weakening further in the summer and early fall after the resumption of interest rate increases by the
Bank of Canada. Prices rebounded late in the year once fears of additional rate increases receded.
- Notwithstanding the unwinding of the pandemic-induced bubble, price levels remain 67% above 2019 levels.
- Sales activity on Sturgeon Lake was subdued in 2023 with only 40 sales, down from 59 sales in 2022 and
60 sales in 2021.
- Sale prices for the 40 sales in 2023 ranged from $535,000 to $2,200,000. The average sale price was
$1,014,000, down slightly from $1,044,000 in 2022.
- The average Sale Price-to-Assessed Value ratio for the 40 sales in 2023 was 2.34, slightly lower than the
average ratio of 2.39 for waterfront sales across the western Kawarthas in 2023, and 12% lower than the
average ratio of 2.67 for Sturgeon Lake sales in 2022.
- Looking forward, I am cautiously optimistic that prices will improve in 2024 as my sense is that many
buyers feel ready to re-enter the market now that the interest rate increase cycle appears to have ended.
2022 Sturgeon Lake Market Value Summary
Western Kawartha waterbodies include Balsam, Cameron, Sturgeon, Pigeon, Canal, Mitchell, Dalrymple, Head, Four Mile and Crystal lakes as well as the Shadow Lake System and the Burnt River.
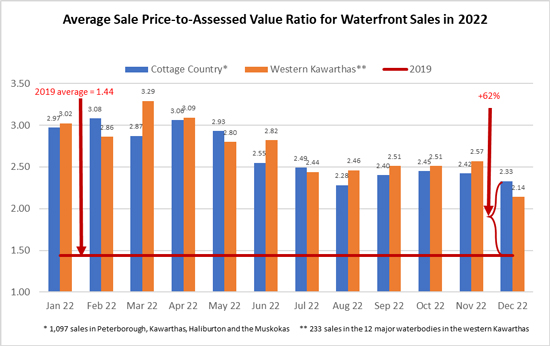
- The chart above summarizes the monthly average Sale Price-to-Assessed Value Ratios in 2022 for the 12
major waterbodies in the western Kawarthas as well as across the entirety of cottage country. I have
included the broader cottage country metric as the larger number of sales in this database adds credibility
to the trends. For example, there were only three sales in the western Kawarthas in December 2022 so I
would not put much faith in the 2.14 metric for that month.
- Prices reached an all-time high in the early months of 2022 as buyers with pre-approved financing at very
low rates chased the few waterfront listings on the market. The result was fierce bidding wars and sale
prices substantially over asking. Buyers became extremely cautious once interest rates started to increase in
late spring, and prices fell materially throughout the summer months before stabilizing in the autumn.
Notwithstanding this retrenchment, price levels in December 2022 remained 62% above pre-pandemic levels.
- There were 59 sales (excluding vacant lots) on Sturgeon Lake in 2022, versus 60 sales in 2021.
- After May 31st only 33 of the 59 active cottage listings sold, with sale prices averaging $111,000 (10%)
under the original asking price.
- Price trends on Sturgeon Lake largely corresponded with the broader waterfront market. The average
sale price-to-assessed value multiple for the 59 sales in 2022 was 2.67, slightly lower than the 2.75 average
multiple realized across the western Kawarthas but in line with the 2.65 multiple realized across cottage
country. The average multiple for Sturgeon Lake in 2021 was 2.65.
- The average sale price of the 59 sales was $1,044,000, down 8% from $1,135,000 in 2021. Sale prices
ranged from $180,000 to $2,980,000.
- It is difficult to predict how prices will evolve over the next 12 months but my sense is that we will return
to normal market conditions with relatively stable prices once the rate increase cycle ceases.
2021 Sturgeon Lake Market Value Summary
*Incorporates sales on Balsam, Cameron, Sturgeon, Canal, Mitchell, Dalrymple, Head, Shadow and Four Mile lakes as well as the Burnt River.
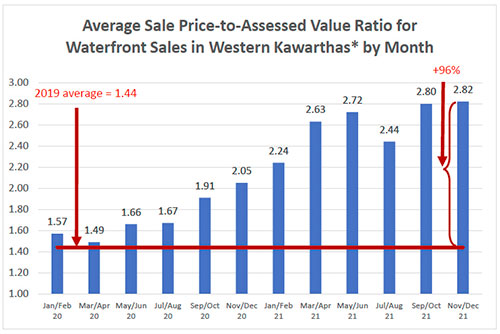
- The chart above summarizes the average Sale Price-to-MPAC Assessed Value Ratio for the 570
waterfront sales across the key waterbodies in the western Kawarthas since January 2020. This chart
is the most effective measure of waterfront price trends due to the large number of data points and
the fact that average sale price-to-assessed value ratios tend to be quite consistent across the major
waterbodies in the western Kawarthas.
- Waterfront prices continued to trend higher through 2021 and ended the year at historic highs and
almost double 2019 levels as pandemic-induced demand reached unprecedented levels. The only
interruption in this upward trend occurred in July and August of 2021 when buyer demand receded in
the expectation that the pandemic would soon be over following the wide vaccination rollout. Demand
and prices quickly bounced back once the Delta and Omicron variants emerged.
- Price trends on Sturgeon Lake closely mirrored the broader western Kawarthas trend with prices
increasing in the latter months of 2021 following a strong spring season and a summer slump.
- The average sale price on Sturgeon Lake in 2021 was $1,135,000, up 43% from $792,000 in 2020.
Sale prices ranged from $350,000 to $5,400,000, which was an all-time high sale price for a waterfront
property on Sturgeon Lake.
- There were 60 sales on Sturgeon Lake in 2021, in line with historical levels but down materially from the
unusually high level of 86 sales in 2020.
- 24 of the 60 sales in 2021 exceeded $1 million in value and 5 sales exceeded $2 million.
- Only 19 of the 60 sales sold for a below-asking sale price, reflective of the dominant strategy of setting an
attractive list price and holding back offers in the hope of receiving multiple offers and an above-asking sale price.
- Looking forward, it is difficult to foresee any material reduction in buyer demand and prices in the
coming year unless we see the cessation of the pandemic and a return to pre-Covid living conditions
and/or materially higher interest rates.
2020 Sturgeon Lake Market Value Summary
- Waterfront market activity on Sturgeon Lake and across the western Kawarthas was especially
volatile throughout 2020. It is therefore necessary to analyze the sales data on a monthly basis in
order to understand the underlying price trends.
- The metric I use to track pricing trends is the Sale Price-to-MPAC Assessed Value Ratio, which is
simply the ratio of the sale price of an individual property to its MPAC assessed value. I calculate this
ratio for each sale recorded, as well as an average ratio for all sales over a given time period.
I consider the extent to which the average changes over time a good proxy for waterfront price trends.
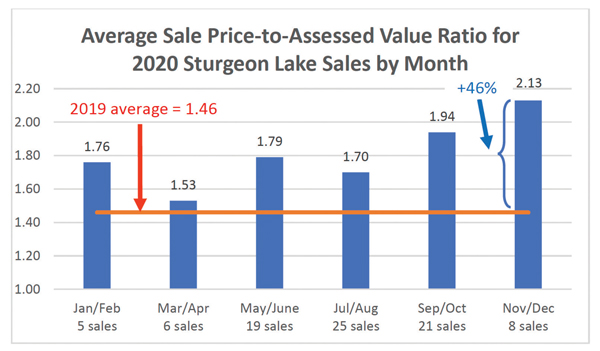
- The chart above summarizes the average Sale Price-to-Assessed Value Ratio for Sturgeon Lake
for each two-month period in 2020. You can see that prices were strong in the first two months of
2020, slumped somewhat during the lockdown months, and increased substantially thereafter. Most
astounding are the post-September 1st results, which saw an additional upward surge in prices from
the summer. The 2.13 ratio realized from November and December sales is indicative of a 46% price
increase from 2019, when prices were mostly flat throughout the year.
- This increase in prices, which is consistent with trends across all major lakes I service in the western
Kawarthas, is attributable primarily to the tidal wave of new demand from buyers in the GTA who are
eager for an escape from the pandemic-induced stresses of urban living.
-
The average sale price for Sturgeon Lake properties in 2020 was $792,000, up 26% from $631,000
in 2019.
- The 84 waterfront sales on Sturgeon Lake in 2020 were significantly higher than in previous years –
there were only 50 sales in 2019.
-
Looking forward, I am optimistic that 2021 will continue to be positive for the waterfront market,
supported by the apparent seismic shift in buyer demand towards waterfront properties, continued
low interest rates and relatively strong real estate markets in the GTA.
Sturgeon Lake Market Value Update ~ August 31, 2020
Sturgeon Lake Market Value Update ~ July 31, 2020
Sturgeon Lake Market Value Update ~ June 30, 2020
Sturgeon Lake Market Value Update ~ April 30, 2020
2019 Sturgeon Lake Market Value Summary
- Prices on Sturgeon Lake continued to trend higher in 2019 despite slower sales activity than in the
previous three years.
- Eighty-three Sturgeon Lake waterfront properties were put on the market in 2019 and only 50 (60%)
sold. Twenty-six (52%) of the 50 sales required one or more price reductions.
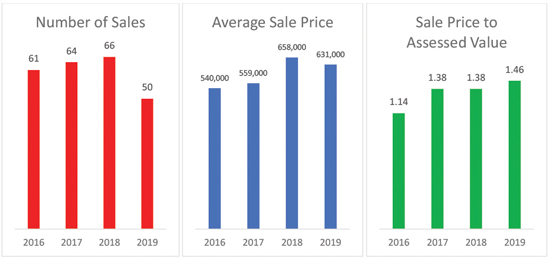
- The average sale price of $631,000 in 2019 was down 4% from the 2018 average of $658,000.
I attribute this decrease more to a change in the mix of properties sold than to a decline in prices,
as there were fewer high-end sales in 2019 than in 2018.
- One metric I track closely to provide insight into pricing trends is the Sale Price-to-MPAC Assessed
Value Ratio. I calculate this ratio for each sale recorded, as well as an average ratio for all sales during
the year. In 2019, the average ratio for the 50 Sturgeon Lake sales was 1.46, up 6% from 1.38 in
2018. In comparison, the average Sale Price-to-Assessed Value ratio for the 185 waterfront sales
across the key lakes and rivers in the western Kawarthas was 1.44, up 3% from 1.40 in 2018.
- Sturgeon Lake properties took longer to sell in 2019, with a median number of days on the market
of 64 versus 52 in 2019. The median number of days on the market for the 185 waterfront sales across the western Kawarthas in 2019 was 47.
- Looking forward, I am cautiously optimistic that 2020 will be a positive year for the waterfront
market. I noticed strong momentum in the fall months – almost half of Kawartha Waterfront Realty’s
2019 sales took place after September 30th, and buyer inquiries to our office have remained strong
through the winter months. Real estate market conditions in the GTA also appear to be improving,
which helps fuel demand for waterfront properties.
Sturgeon Lake Market Value Update ~ October 15, 2019
Sturgeon Lake Market Value Update ~ August 31, 2019
Sturgeon Lake Market Value Update ~ July 31, 2019
Sluggish sales in July
- Listing activity was relatively strong in July, with 12 new listings, but there were only three sales during the month. July is historically a slow sales month on Sturgeon Lake however. Year-to-date sales continue to be significantly lower than in the same periods in 2017 and 2018.
- The average sale price in 2019 is $603,000, down from the $658,000 average for all 2018 sales. This is indicative of the fact that most 2019 sales have been for lower-price point properties – there has been only one sale price in excess of $1 million so far in 2019.
- The average sale price-to-assessed value ratio for 2019 sales is 1.49, up from the 2018 full year average of 1.38. However, if the highest priced sale in 2019 is excluded from the data, the 2019 ratio falls to 1.43, only slightly above the 2018 level. This data therefore suggests that prices are flat year-over-year.
Sturgeon Lake Market Value Update ~ June 30, 2019
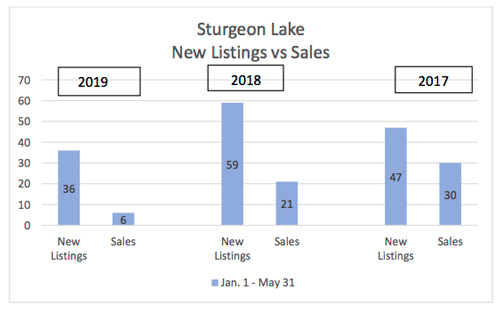
Sturgeon Lake Market Value Update ~ May 31, 2019
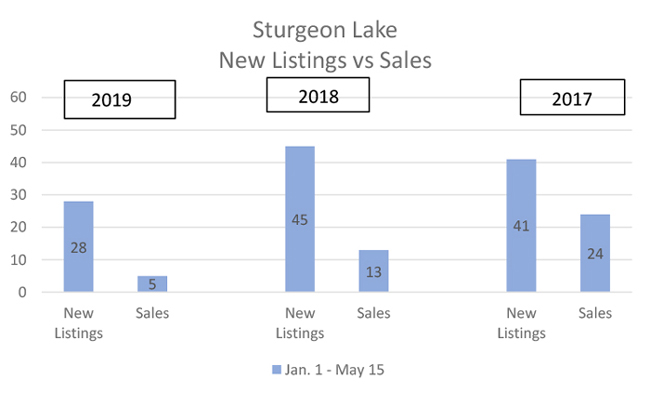
Sturgeon Lake Market Value Update ~ May 15, 2019
2018 Sturgeon Lake Market Value Summary
- The average sale price was $658,000 in 2018, up 18% from 2017 and 66% from 2014.
- There were 66 sales in 2018, in line with the 64 sales recorded in 2017.
- One metric I track closely to provide insight into pricing trends is the Sale Price-to-MPAC Assessed
Value Ratio. I calculate this ratio for each sale recorded, as well as an average ratio for all sales during
the year. In 2018, the average ratio for the 66 Sturgeon Lake sales was 1.38, unchanged from 2017.
The average ratio across the six key lakes in our region (Sturgeon/Cameron/Balsam/Four Mile/Shadow/
Head) was also unchanged from 2017 at 1.38. These ratios support my belief that waterfront prices
were stable year-over-year.
- Waterfront properties took much longer to sell in 2018 – the median number of days on the market
for properties sold on Sturgeon Lake was 52 days in 2018 versus 21 days in 2017. My explanation for
this increase is that buyers from the GTA who had experienced a double-digit percentage decline in
their home values were expecting similar declines in cottage prices in 2018. Cottage sellers, on the
other hand, were not willing to reduce prices in line with GTA trends as a result of their belief that
“bubble” conditions were not evident in our market. This gap in pricing expectations was resolved
largely in favour of sellers, as evidenced by stable year-over-year prices.
- Other key takeaways from the 2018 market include:
- The post-September 1st market was very strong on Sturgeon Lake – 25 waterfront properties sold
on the lake after September 1st, versus 13 in 2017.
- Buyers almost uniformly desire to use their cottages year-round – if you have a three-season
property, it would be well worth your while to investigate the feasibility of enhancing it to four-
season capability.
- Looking forward, I am hoping that the strong momentum from the fall 2018 market will carry into 2019.
However, while the prospect of higher interest rates in 2019 appears to be receding, the late-2018
correction in financial markets has the potential to impact buyer demand for waterfront properties.
As always, real estate market conditions in the GTA will heavily influence our market.
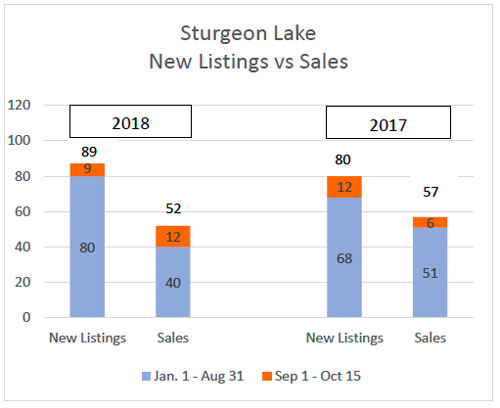
Sturgeon Lake Market Value Update ~ October 15th, 2018
Fall market sales activity has been strong, with some evidence of sale price discounting
- There have been 12 post-Labour Day sales to October 15th, compared to 6 in the same period last year.
- The 12 post-Labour Day sales yielded an average Sale Price-to-MPAC Assessed Value ratio of 1.34, down from the 1.44 ratio for 2018 sales up to August 31. This may be indicative of sellers’ receptiveness to accepting lower prices prior to the end of the season. The average number of days on the market for these post-Labour day sales was also much higher at 93 days versus 54 days for 2018 sales up to August 31 – again indicative of seller receptiveness to lower prices for properties that have sat on the market for some time.
- The average sale price for the 52 sales to-date in 2018 is $649,000, up significantly from the average sale price of $559,000 for all sales in 2017. The average Sale Price-to-MPAC Assessed Value ratio for the 52 sales so far this year is 1.42, up slightly from the 1.38 ratio realized for all sales on Sturgeon Lake last year. There is a wide dispersion of ratios among the 52 sales, so buyers are cautioned against using the average ratio to assess whether an individual listing is over- or under-priced. Properties that have had significant upgrades tend to have higher sale price-to-assessed value ratios.
Sturgeon Lake Market Value Update ~ August 31, 2018
Sturgeon Lake Market Value Update ~ July 31, 2018
Sturgeon Lake Market Value Update ~ June 30, 2018
Sturgeon Lake Market Value Update ~ May 31, 2018
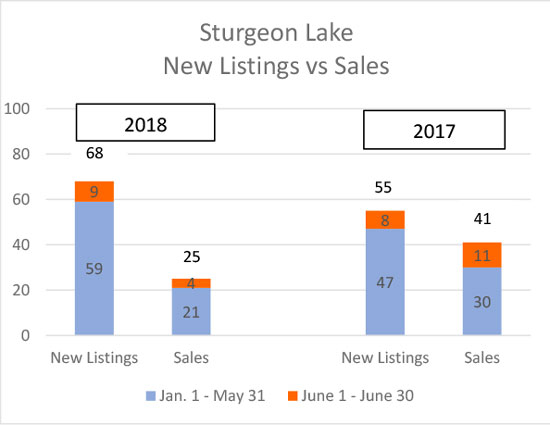
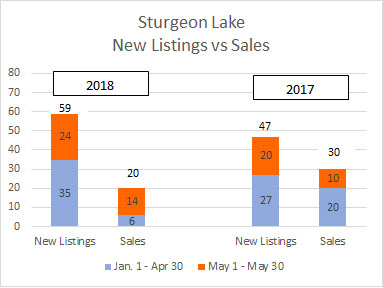
Much stronger sales in May, and prices are holding up.
- May was a much stronger month for Sturgeon Lake sales, due perhaps to the quick transition to summer weather. There were 24 new listings and 14 sales in May 2018, compared to 20 new listings and 10 sales in the same period last year. Year-to-date numbers still indicate a weaker market than last year, with 59 new listings so far this year and only 20 sales.
- The average sale price for the 20 sales this year is $573,000, down 6.7% from the January 1 to May 31 period last year, but up 2.5% when compared to the average sale price of $559,000 for all of 2017.
- The average Sale Price-to-MPAC Assessed Value ratio for the 20 sales so far this year is 1.41, up slightly from the 1.39 ratio realized on the 30 sales in the same period last year, and the 1.38 ratio realized for all sales on Sturgeon Lake last year.
- These last two points are very instructive in terms of the direction of the market. Feedback from our buyer agents indicate that there was a sizable gap between seller and buyer expectations earlier in the year, with buyers expecting to pay lower prices in line with GTA trends, while sellers were reluctant to accept lower prices in the belief that there had been no bubble in this region that needed to be burst. Based on the most recent evidence, this gap seems to be resolving in favour of sellers.
Sturgeon Lake Market Value Update ~ May 18, 2018
- Since April 30, activity has picked up on Sturgeon Lake, with 10 new listings and 7 new sales on the lake (as well as an additional 7 conditional sales). On a year-to-date basis (Jan. 1/18 – May 18/18), total sales volume on the lake is $7.3 million, down significantly from $13.2 million for the same period last year.
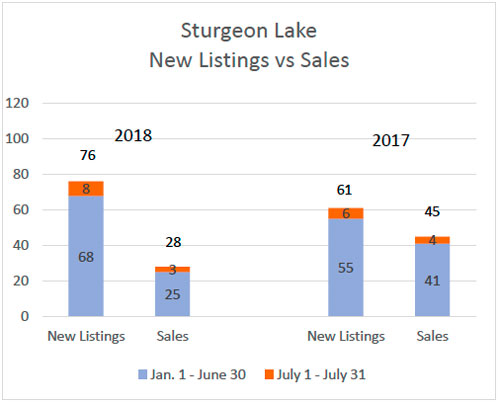
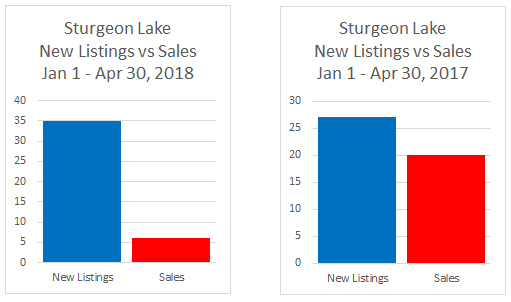
Sturgeon Lake Market Value Update ~ April 30, 2018
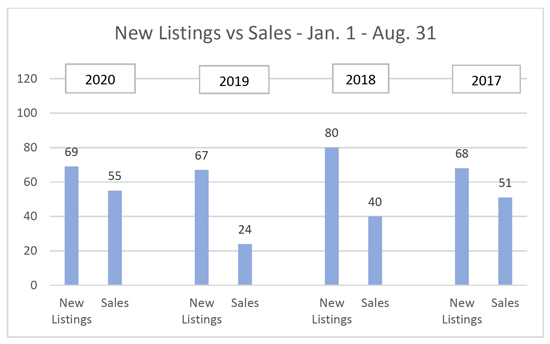
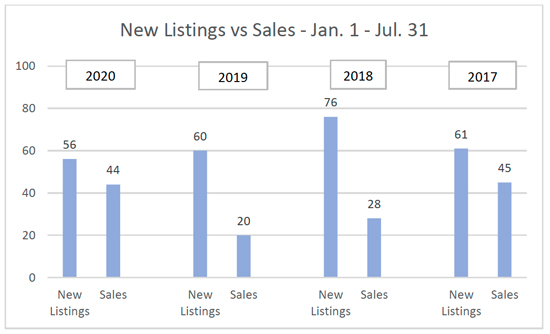
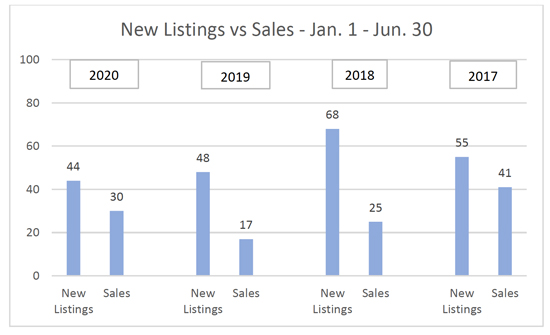
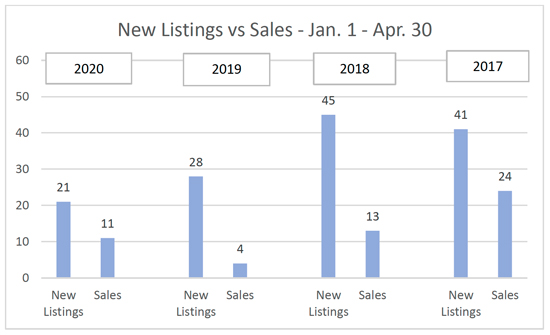
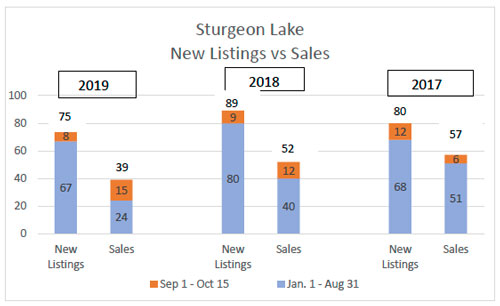
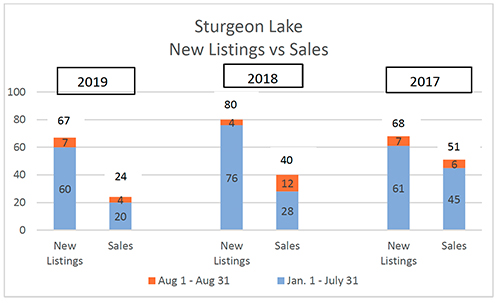
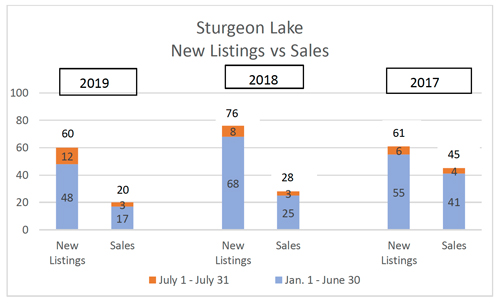
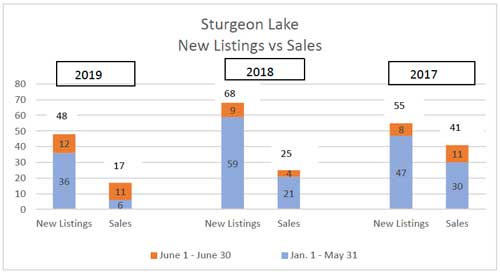
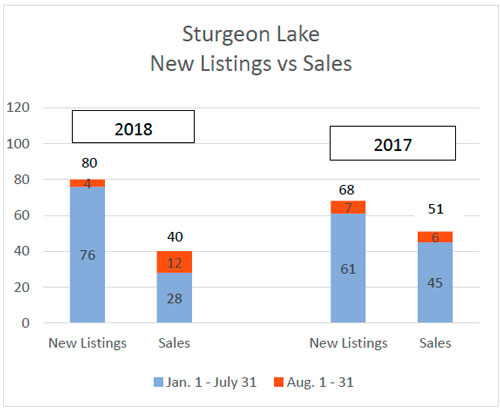
- Evidence indicates that Sturgeon Lake is now a buyer’s market – in sharp contrast to the strong seller’s market that prevailed last spring. The charts below illustrate this swing. They compare the number of new listings in a given period to the number of sales in the same period. A high proportion of sales in relation to new listings indicates a seller’s market, while a low proportion indicates a buyer’s market. In the January 1 – April 30, 2018 period, there have been 35 new listings and only six sales. Last year during the same period there were 27 new listings and 20 sales.
- The slower start is most likely the result of a combination of poor spring weather and more balanced market conditions. It is not surprising that market conditions are weaker in comparison to last spring when there was a significant overhang of buyers with substantial equity positions in their GTA homes.
- Another factor likely resulting in lower sales activity is that asking prices are relatively high. As noted in the 2017 summary below, the average sale price to assessed value ratio for all waterfront sales on Sturgeon Lake in 2017 was 1.38. In other words, the sale price for a given property was, on average, 1.38 times that property’s 2016 MPAC assessed value. For the 24 active listings on Sturgeon Lake as at April 30, 2018, the average asking price to assessed value ratio is 1.55. In other words, the asking price for a current waterfront listing on Sturgeon Lake is, on average, 1.55 times that property’s 2016 MPAC assessed value. This difference in today’s asking prices versus last year’s sales prices may well be leading potential buyers to balk at paying these higher asking prices, especially given the year-over-year declines in prices they are familiar with in the GTA.
- Five of the six sales so far in 2018 have been in the $500,000 - $600,000 range, with no sales above $600,000. In contrast, 10 of the 20 sales in the same period last year were for greater than $600,000.
2017 Sturgeon Lake Summary
- The average sale price was $559,000 in 2017, up 6% from 2016, and 41% from 2014.
- Sixty-four properties were sold in 2017, down from 81 in 2016.
- Market dynamics on Sturgeon Lake (and all of the western Kawarthas) were influenced by events in the GTA housing market. The spring market was especially frothy, with large numbers of buyers competing for relatively few listings. Bidding wars were common.
- Cottage buyer interest receded somewhat after the imposition of the foreign buyer tax in the GTA. Mid-priced cottages (up to $700,000) continued to sell quickly, however, while sales of higher priced cottages slowed considerably.
- The trend to higher market values on Sturgeon Lake was supported by another metric we track closely – the Sale Price to Assessed Value Ratio. In 2017, the average ratio for Sturgeon Lake was 1.38, a 18% increase from the 1.17 ratio realized in 2016.
- The 2017 trend on Sturgeon Lake towards higher average sale prices, higher Sale Price to Assessed Value ratios, and a relatively low volume of listings, is consistent with trends on other lakes we track closely (Balsam/Cameron/Four Mile/Shadow/Head). However, the buyer population differs somewhat on Sturgeon Lake in comparison to these other lakes in that Sturgeon Lake attracts a higher proportion of buyers looking to live year-round on the lake. This is primarily due to Sturgeon Lake’s proximity to services and attractions located in Lindsay, Bobcaygeon and Fenelon Falls.