Whether you are an owner of a cottage who is considering selling, or a prospective buyer, it is important to be as informed as possible on local market conditions. In my previous career as a managing director at a major Canadian financial institution, I developed a deep appreciation for the importance of sound analytics, and have applied these concepts to glean insights on broader market trends as well as individual property valuation. In an effort to promote greater transparency and efficiency in our local markets, I am pleased to provide statistics and commentary on each of the major lakes in our core service area. If you are interested in a more precise valuation of your property, please contact me at (705) 438-3000 or email me and I would be happy to provide a value estimate at no cost.
~ David Donais, Broker of Record/Owner
2025 Shadow Lake System Market Value Summary
There were 21 waterfront properties listed on MLS on Shadow Lake/Gull River in 2025, and only 8 of these listings sold.
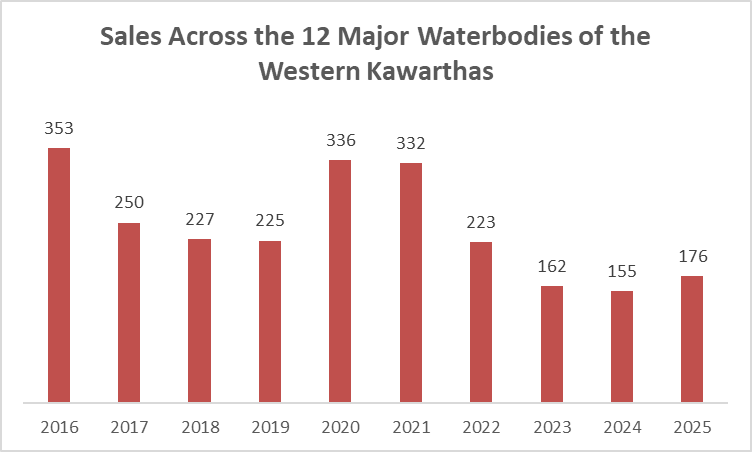
This pattern of high listing volumes and low sales was also evident across the broader market of the 12 major waterbodies of the western Kawarthas, where there were 426 waterfront listings in 2025 and only 176 sales. The 176 sales can be divided into two distinct groups in terms of how easy they were to sell:
- 87 sales required no price reductions, sold relatively quickly (median Days on Market of 20) at close to the list price (average Sale Price/List Price Ratio of 95%), and had an average Sale Price-to-MPAC Assessed Value Ratio of 2.21.
- The remaining 89 sales required one or more price reductions, took much longer to sell (median Days on Market of 99 days) with larger discounts (average Sale Price/Original List Price Ratio of 81%), and at a lower average Sale Price-to-MPAC Assessed Value Ratio of 2.08.
I attribute these divergent results between easy and hard to sell properties to a combination of the following:
- Buyers had plenty of listings to choose from in 2025, and while they were willing to step up with strong offers for properties that met their criteria (i.e. usually high quality dwellings and/or waterfront), they demanded steep discounts on lower quality properties.
- Properties with overly ambitious initial list prices sat on the market and sellers were forced to reduce their list prices in a market where prices were falling.
- Partially offsetting these impacts were instances where the list price was set too low, resulting in a quick sale but at a lower price than would be the case if the property had more time on the market to attract buyers.
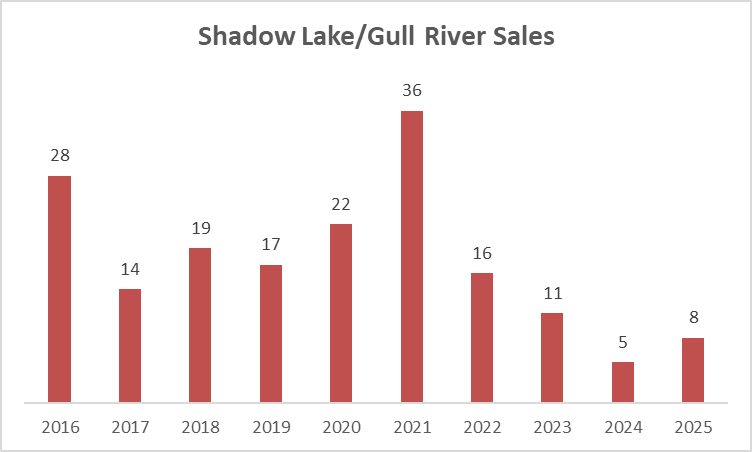
The 8 sales on Shadow Lake/Gull River in 2025 were up from only 5 in 2024 but remained low from a historical perspective, consistent with waterfront sales trends across the western Kawarthas.
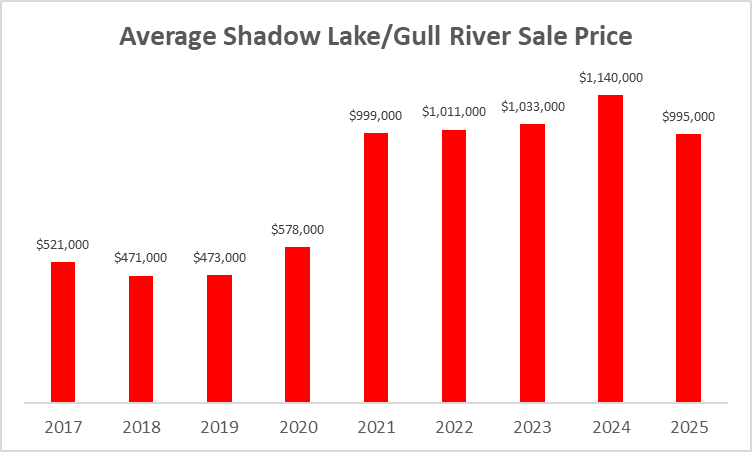
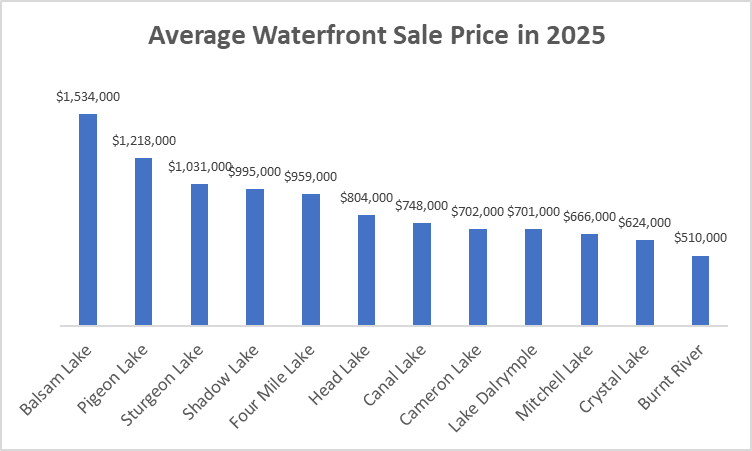
The average Shadow Lake/Gull River sale price of $995,000 in 2025 was down moderately from 2024 but resided near the higher end of the range of average sale prices across the western Kawarthas in 2025.
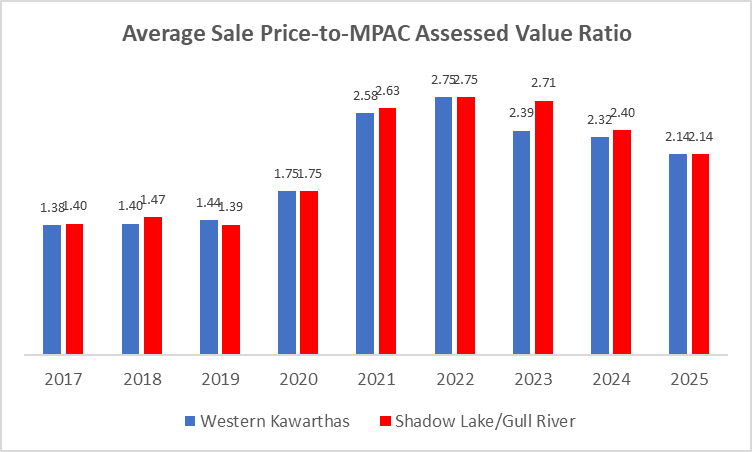
The average Sale Price-to-MPAC Assessed Value Ratio of the 8 Shadow Lake/Gull River sales in 2025 of 2.14 was the lowest since 2021, and this trend of falling prices is consistent with that of the broader western Kawarthas waterfront market since the Covid bubble burst in mid-2022.
2024 Shadow Lake System Market Value Summary
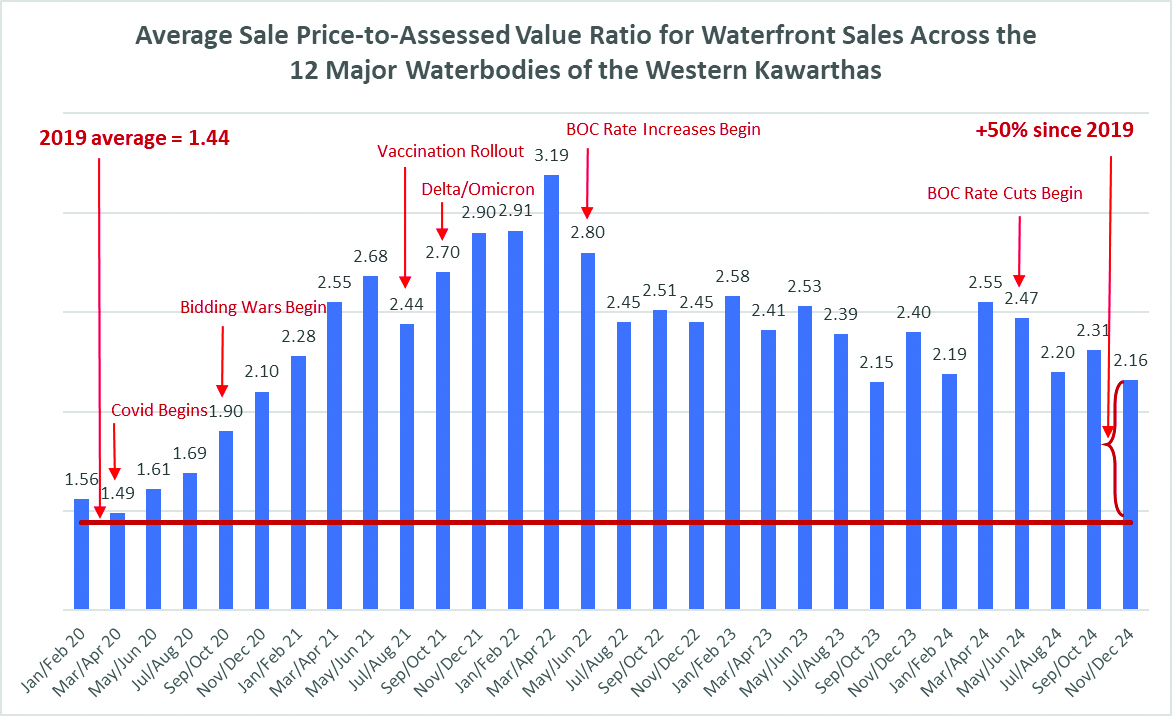
The market for waterfront properties remained very weak throughout 2024, with prices yet to respond positively to the five successive Bank of Canada rate reductions that began in June 2024.
The 12 major western Kawartha waterbodies include Balsam, Cameron, Canal, Crystal, Dalrymple, Four Mile, Head, Mitchell, Pigeon and Sturgeon lakes as well as the Shadow Lake System and the Burnt River.
Sales volumes were also extremely low in 2024, as buyers largely remained on the sidelines.
The difficulty in selling waterfront properties in 2024 was further evidenced by the fact that only 44% (155) of the 356 waterfront properties listed across the western Kawarthas in 2024 sold. And almost half (74) of those 155 properties that did sell required one or more price reductions. These 74 sales requiring price reductions were typically on the market for an extended period (median number of days on market of 136 days) and sold for significant discounts to the original list price (18% on average).
On the Shadow Lake System, 15 properties were listed in 2024 and only 5 sold, with sale prices between $465,000 and $1,630,000.
There are some signs of an improved market heading into 2025. 31 percent of the 155 sales in 2024 across the western Kawarthas took place after September 1st – the highest proportion since 2019. We have also been receiving higher volumes of inquiries in recent months from buyers interested in purchasing a waterfront property.
However, any rise in waterfront prices arising from higher demand may be limited by increased listing supply – the unusually low number of sales since the Covid bubble burst in mid-2022 likely means there is a significant overhang of listings poised to come to market at the first sign of improving market conditions.
2023 Shadow Lake System Market Value Summary
The 12 major western Kawartha waterbodies include Balsam, Cameron, Canal, Crystal, Dalrymple, Four Mile, Head, Mitchell, Pigeon and Sturgeon lakes as well as the Shadow Lake System and the Burnt River.
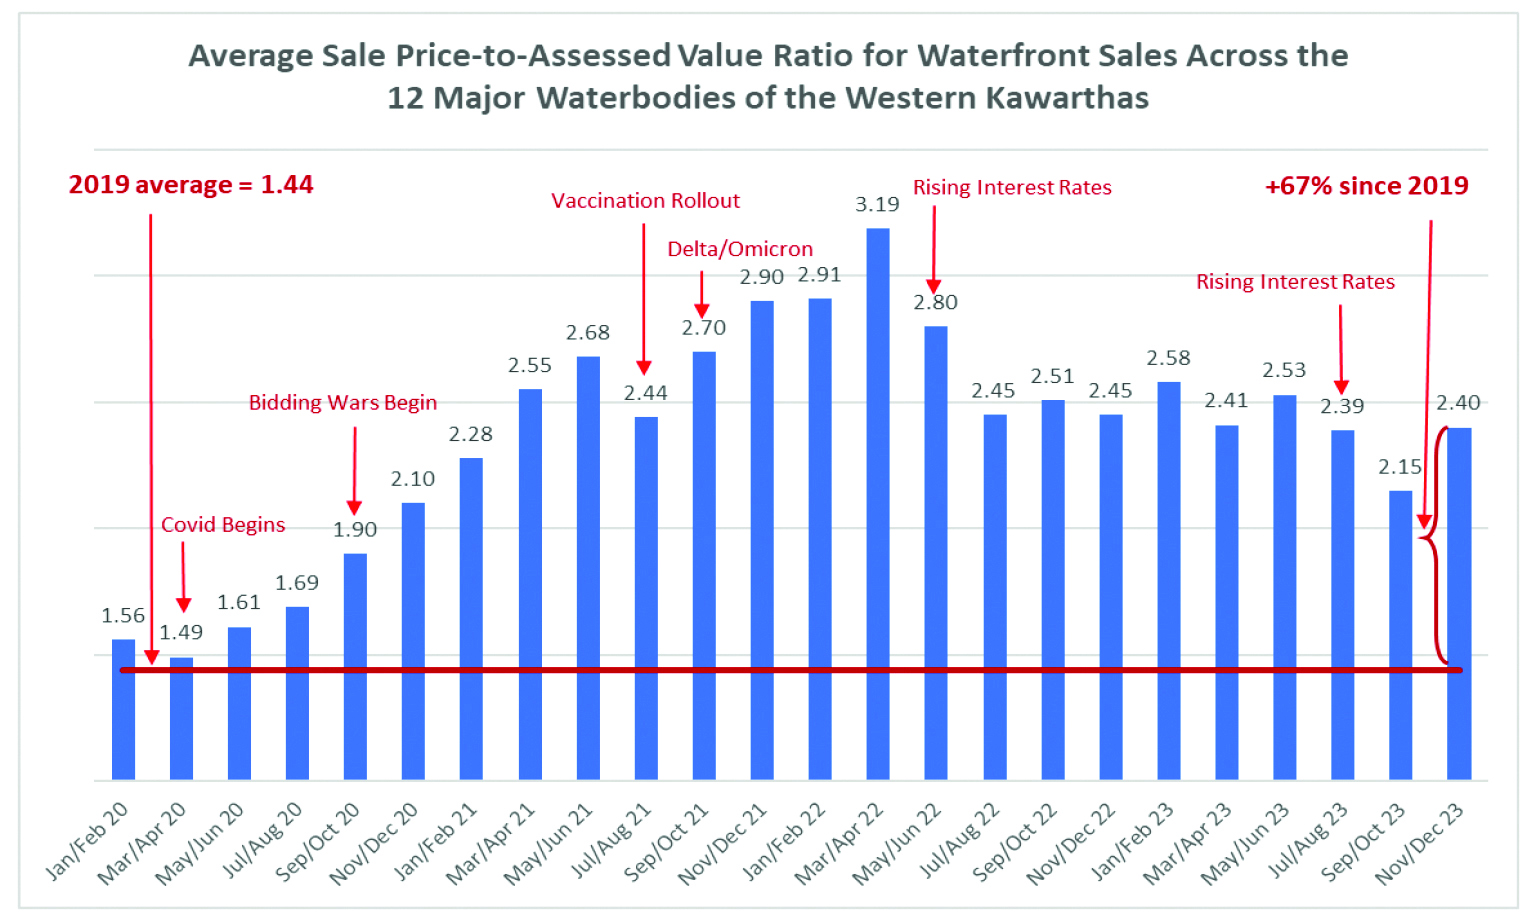
- The metric I use to track price trends is the Sale Price-to-MPAC Assessed Value Ratio, which is simply the
ratio of the sale price of an individual property to its MPAC assessed value. I calculate this ratio for each
sale recorded, as well as an average ratio for all sales in each time period.
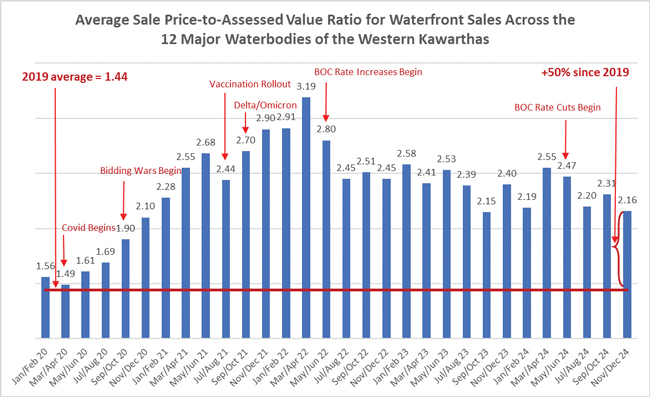
- The chart above summarizes the average Sale Price-to-Assessed Value Ratios for the almost 1,100
waterfront sales across the 12 major waterbodies in the western Kawarthas since January 2020.
This chart effectively tells the story of the pandemic market and its aftermath.
- Prices were choppy in 2023, rising early in the year, falling with the onset of the banking crisis in March,
and weakening further in the summer and early fall after the resumption of interest rate increases by the
Bank of Canada. Prices rebounded late in the year once fears of additional rate increases receded.
- Notwithstanding the unwinding of the pandemic-induced bubble, price levels remain 67% above 2019
levels.
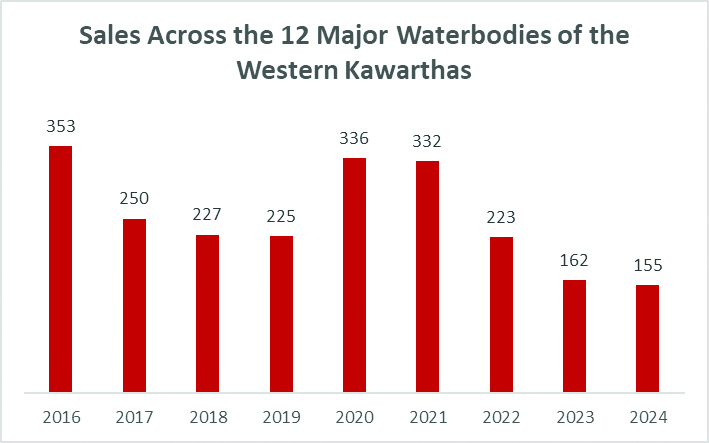
- There were 164 MLS waterfront sales across the western Kawarthas in 2023, down a substantial 30%
from 233 sales in 2022 and 51% from 336 sales in 2021.
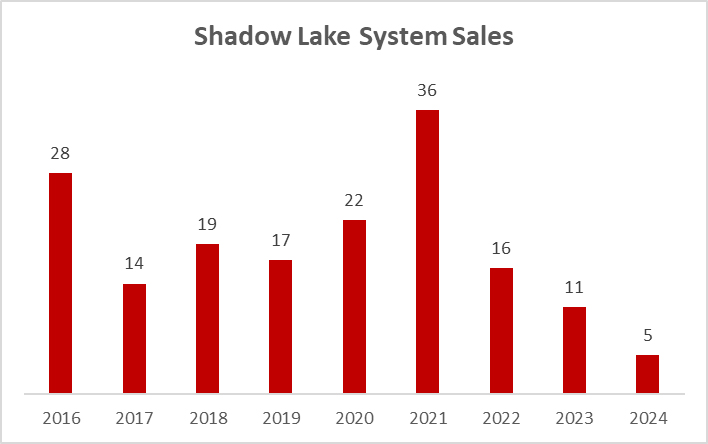
- Sales activity on the Shadow Lake System was also subdued in 2023, with 11 sales compared to 16 sales
in 2022 and 36 sales in 2021.
- Sale prices for the 11 sales in 2023 ranged from $410,000 to $2,410,000, and the average Sale Price-to-Assessed
Value ratio of the sales was 2.71, substantially higher than the average ratio of 2.39 for waterfront sales
across the western Kawarthas in 2023.
- Looking forward, I am cautiously optimistic that prices will improve in 2024 as my sense is that many
buyers feel ready to re-enter the market now that the interest rate increase cycle appears to have ended.
2022 Shadow Lake System Market Value Summary
Western Kawartha waterbodies include Balsam, Cameron, Sturgeon, Pigeon, Canal, Mitchell, Dalrymple, Head, Four Mile and Crystal lakes as well as the Shadow Lake System and the Burnt River.
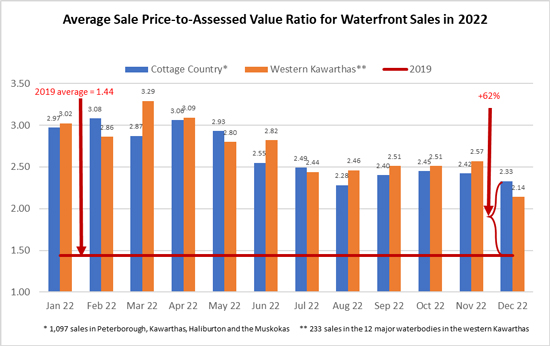
- The chart above summarizes the monthly average Sale Price-to-Assessed Value Ratios in 2022 for the 12
major waterbodies in the western Kawarthas as well as across the entirety of cottage country. I have
included the broader cottage country metric as the larger number of sales in this database adds credibility
to the trends. For example, there were only three sales in the western Kawarthas in December 2022 so I
would not put much faith in the 2.14 metric for that month.
- Prices reached an all-time high in the early months of 2022 as buyers with pre-approved financing at very
low rates chased the few waterfront listings on the market. The result was fierce bidding wars and sale
prices substantially over asking. Buyers became extremely cautious once interest rates started to
increase in late spring, and prices fell materially throughout the summer months before stabilizing in
the autumn. Notwithstanding this retrenchment, price levels in December 2022 remained 62% above
pre-pandemic levels.
- There were 16 sales on the Shadow Lake System in 2022, down substantially from the 36 sales in 2021.
- Sale price trends on the Shadow Lake System corresponded with the larger market. The average sale
price-to-assessed value multiple for the 16 sales in 2022 was 2.75, identical to the average multiple across
the western Kawarthas and slightly higher than the 2.65 multiple realized across cottage country. The
average multiple on the Shadow Lake System in 2021 was 2.63.
- The average sale price of the 16 sales was $1,011,000, up 1% from $999,000 in 2021. Sale prices ranged
from $595,000 to $1,749,000.
- It is difficult to predict how prices will evolve over the next 12 months but my sense is that we will return
to normal market conditions with relatively stable prices once the rate increase cycle ceases.
2021 Shadow Lake System* Market Value Summary
*Incorporates waterfront sales on Shadow and Silver lakes and on the Gull River from the Kawartha Lakes/Haliburton boundary in the north to Coboconk in the south.
**Incorporates sales on Balsam, Cameron, Sturgeon, Canal, Mitchell, Dalrymple, Head and Four Mile lakes as well as the Shadow Lake System and the Burnt River.
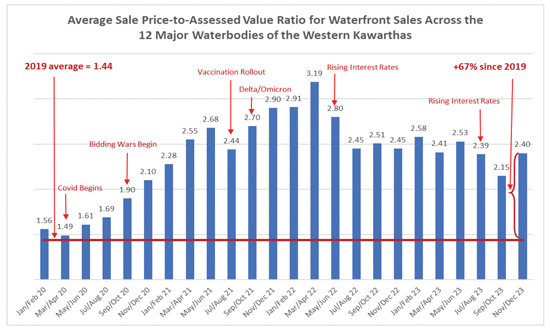
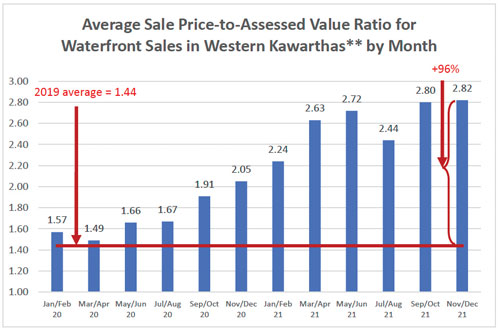
- The chart above summarizes the average Sale Price-to-Assessed Value Ratio for the 570 waterfront
sales across the key waterbodies in the western Kawarthas since January 2020. This chart is the most
effective measure of waterfront price trends due to the large number of data points and the fact that
average sale price-to-assessed value ratios tend to be quite consistent across the major waterbodies in
the western Kawarthas.
- Waterfront prices continued to trend higher through 2021 and ended the year at historic highs and
almost double 2019 levels as pandemic-induced demand reached unprecedented levels. The only
interruption in this upward trend occurred in July and August of 2021 when buyer demand receded in
the expectation that the pandemic would soon be over following the wide vaccination rollout.
Demand and prices quickly bounced back once the Delta and Omicron variants emerged.
- There were 36 properties sold on the Shadow Lake System in 2021, substantially higher than the 22 sales
in 2020 and 17 sales in 2019.
- The average sale price on the Shadow Lake System in 2021 (excluding building lot sales) was $999,000,
up 42% from $578,000 in 2020. Sale prices ranged from $395,000 to $2,500,000, with the latter
representing an all-time high sale price for a waterfront property on the Shadow Lake System.
3 sales were for $2 million or higher.
- 20 of the 36 sales in 2021 sold above the asking price, reflective of the dominant strategy of setting an
attractive list price and holding back offers in the hope of receiving multiple offers.
- Looking forward, it is difficult to foresee any material reduction in buyer demand and prices in the
coming year unless we see the cessation of the pandemic and a return to pre-Covid living conditions
and/or materially higher interest rates.
2020 Shadow Lake System Market Value Summary
- Waterfront market activity on the Shadow Lake System and across the western Kawarthas was
especially volatile throughout 2020. It is therefore necessary to analyze the sales data on a monthly basis in order to understand the underlying price trends.
- The metric I use to track price trends is the Sale Price-to-MPAC Assessed Value Ratio, which is simply
the ratio of the sale price of an individual property to its MPAC assessed value. I calculate this ratio for
each sale recorded, as well as an average ratio for all sales over a given time period. I consider the
extent to which the average changes over time a good proxy for waterfront price trends.
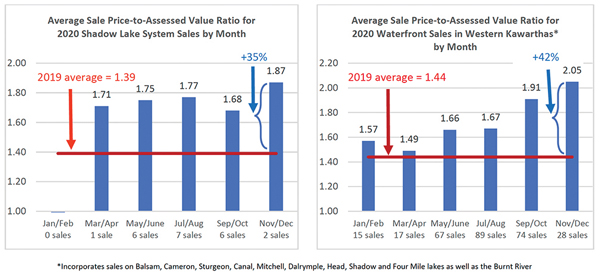
- The charts above summarize the average Sale Price-to-Assessed Value Ratios for each two-month
period in 2020. I have included a chart for both the Shadow Lake System and for waterfront sales
across the western Kawarthas as the latter incorporates a larger number of sales and is therefore
more statistically significant. You can see that for the western Kawarthas, prices were strong in the first
two months of 2020, slumped somewhat during the lockdown months, and increased substantially
thereafter. Most astounding are the post-September 1st results, which saw an additional upward surge
in prices from the summer. The 2.05 ratio realized from November and December sales across the
western Kawarthas is indicative of a 42% price increase from 2019, when prices were mostly flat
throughout the year.
- This increase in prices is attributable primarily to the tidal wave of new demand from buyers in the GTA
who are eager for an escape from the pandemic-induced stresses of urban living.
- The average sale price for Shadow Lake System properties (excluding building lot sales) in 2020 was
$578,000, up 22% from $473,000 in 2019. Sale prices on the Shadow Lake System in 2020 ranged from
$200,000 to $1,150,000.
- The 22 sales on the Shadow Lake System in 2020 were up slightly from 17 sales in 2019.
- Looking forward, I am optimistic that 2021 will continue to be positive for the waterfront market,
supported by the apparent seismic shift in buyer demand towards waterfront properties, continued low
interest rates, and relatively strong real estate markets in the GTA.
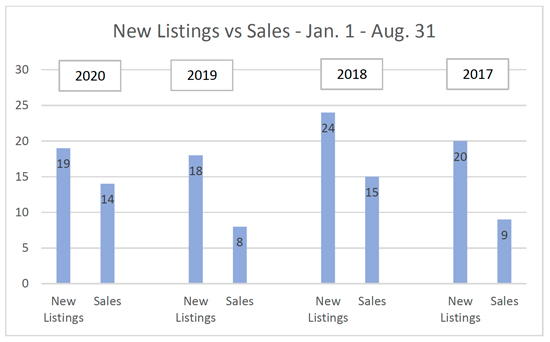
Shadow Lake System Market Value Update ~ August 31, 2020
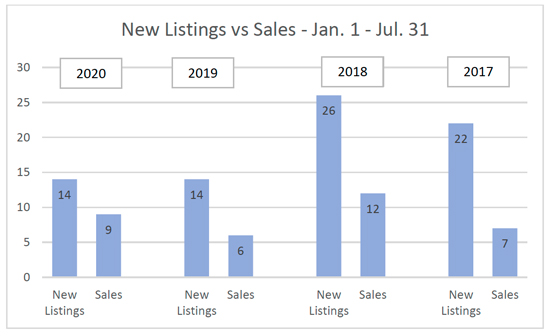
Shadow Lake System Market Value Update ~ July 31, 2020
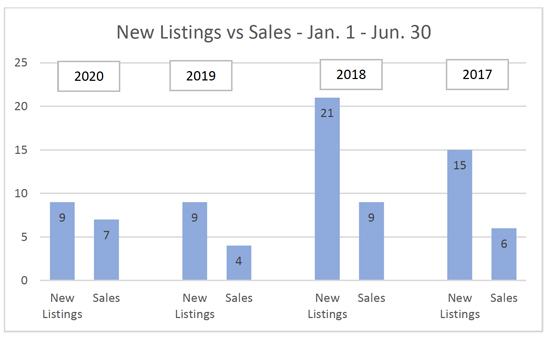
Shadow Lake System Market Value Update ~ June 30, 2020
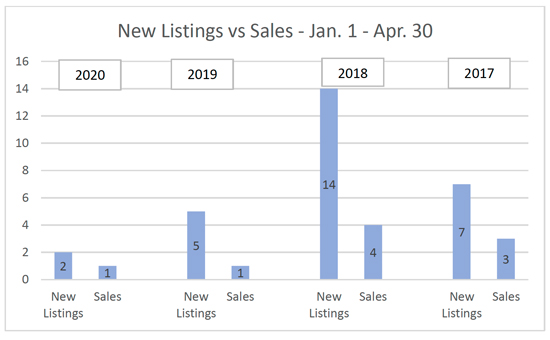
Shadow Lake System Market Value Update ~ April 30, 2020
2019 Shadow Lake Market Value Summary
- Twenty-six Shadow Lake System waterfront properties were put on the market in 2019 and 17 (66%)
sold. Five (29%) of the 17 sold properties required one or more price reductions. Across the 10 key
lakes and rivers in the western Kawarthas, 302 waterfront properties were put on the market in 2019
and 185 (61%) sold. Seventy-three (39%) of these sold properties required price reductions.
- Twelve of the 17 sales on the Shadow Lake System were on the Gull River sections. In 2018, 15 of the
19 sales were on the Gull River. Listings on Shadow and Silver lakes continue to be very scarce.
- The average sale price of $473,000 in 2019 was in line with the 2018 average. Sales prices in 2019
ranged from $265,000 to $950,000.
- One metric I track closely to provide insight into pricing trends is the Sale Price-to-MPAC Assessed
Value Ratio. I calculate this ratio for each sale recorded, as well as an average ratio for all sales during
the year. In 2019, the average ratio for the 17 Shadow Lake System sales was 1.39, down 5% from the
average ratio of 1.47 realized in 2018. This decrease is attributable primarily to a decline in prices on
the Gull River sections, where the average ratio declined to 1.44 in 2019 from 1.59 in 2018. This decline
was most likely caused by heightened sensitivities of buyers to flood risk arising from the widespread
flood damage that occurred across many areas of cottage country in the spring of 2019.
- The average Sale Price-to-MPAC Assessed Value Ratio across the 185 waterfront properties that sold
on the 10 key lakes and rivers in the western Kawarthas was 1.44 in 2019, up 3% from 1.40 in 2018.
- Looking forward, I am cautiously optimistic that 2020 will be a positive year for the waterfront market.
I noticed strong momentum in the fall months – almost half of Kawartha Waterfront Realty’s 2019 sales
took place after September 30th, and buyer inquiries to our office have remained strong in the early
winter months. Real estate market conditions in the GTA also appear to be improving, which helps fuel
demand for recreational properties.
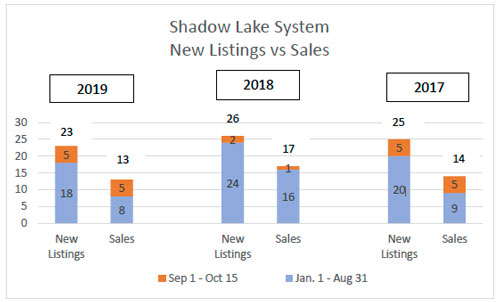
Shadow Lake System Market Value Update ~ October 15, 2019
Strong fall market in Gull River sections.
- Listing and sales activity picked up over the September 1 to October 15 period, with five new listings and sales. Four of the sales were in the Gull River sections near Norland.
- The average sale price for the eight sales so far in 2019 is $445,000, down from the average $471,000 sale price in 2018.
- The average sale price-to-assessed value ratio for the eight sales in 2019 is 1.47, unchanged from the 1.47 average ratio for all sales in 2018.
- There were 9 listings on the Shadow Lake System as at October 15, 2019.
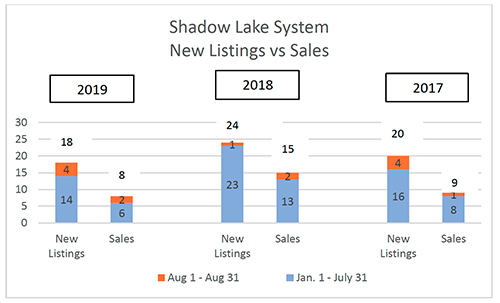
Shadow Lake System Market Value Update ~ August 31, 2019
Reduced market activity so far in 2019.
- Listing and sales activity has been well below 2018 levels for the same period. This is attributable primarily to reduced market activity in the Gull River sections.
- The average sale price for the eight sales so far in 2019 is $475,000, in line with the average $471,000 sale price in 2018. One of the sales in July 2019 was for the second highest ever sale price on Shadow Lake.
- The average sale price-to-assessed value ratio for the eight sales in 2019 is 1.50, slightly above the 1.47 average ratio for all sales in 2018.
- There were 11 active listings on the Shadow Lake System as at August 31, 2019.
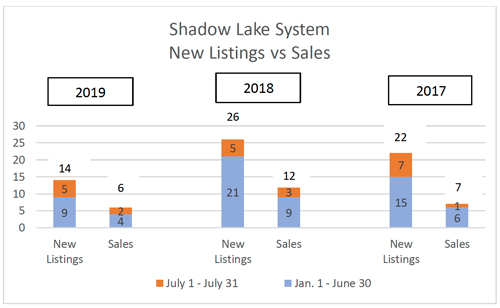
Shadow Lake System Market Value Update ~ July 31, 2019
Far less market activity to-date in 2019 than in 2018.
- Listing and sales activity remains well below 2018 and 2017 levels for the same period. This is attributable primarily to reduced market activity in the Gull River sections.
- The average sale price for the six sales so far in 2019 is $508,000, up from the average $471,000 sale price in 2018. One of the sales in July 2019 was for the second highest ever sale price on Shadow Lake.
- The average sale price-to-assessed value ratio for the four sales in 2019 is 1.54, slightly above the 1.47 average ratio for all sales in 2018.
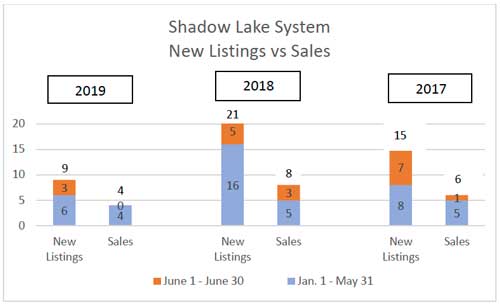
Shadow Lake System Market Value Update ~ June 30, 2019
Far less market activity to-date in 2019 than in 2018.
- The low levels of new listings and sales is no doubt attributable to the late spring and persistent high-water levels in the Shadow Lake System. The recent return to more normal levels may result in increased activity.
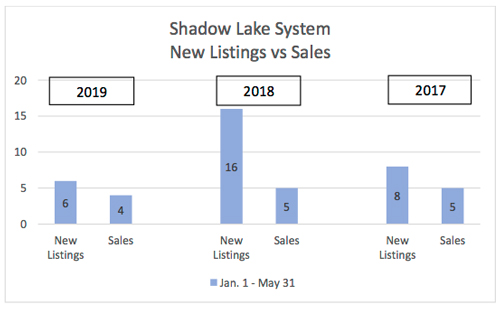
Shadow Lake System Market Value Update ~ May 31, 2019
Far less market activity to-date in 2019 than in 2018.
- The low levels of new listings and sales is no doubt attributable to the late spring and persistent high-water levels in the Shadow Lake System. The recent return to more normal levels may result in increased activity.
- There is currently only one listing on Shadow Lake – the remainder are on the Gull River sections.
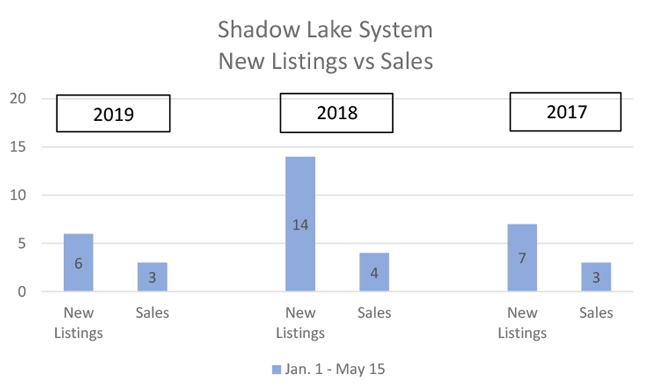
Shadow Lake System Market Value Update ~ May 15, 2019
Listing activity is down from 2018 levels.
- The low levels of new listings is no doubt attributable primarily to the late spring and persistent high-water levels in the Shadow Lake System.
2018 Shadow Lake Market Value Summary
- The average sale price was $471,000 in 2018, down 10% from $521,000 in 2017. Contributing to this
decline was the fact that 15 of the 19 sales in 2018 were on the Gull River, which tend to attract lower
prices than properties on Shadow and Silver lakes.
- One metric I track closely to provide insight into pricing trends is the Sale Price-to-MPAC Assessed
Value Ratio. I calculate this ratio for each sale recorded, as well as an average ratio for all sales during
the year. In 2018, the average ratio for the 19 Shadow Lake system sales was 1.47, up from the average
ratio of 1.40 realized in 2017. The average ratio across the six key lakes in our region (Head/Shadow/
Four Mile/Balsam/Cameron/Sturgeon) was 1.38, unchanged from 2017. These ratios support my belief
that waterfront prices were stable year-over-year.
- Waterfront properties took much longer to sell in 2018 – the median number of days on the market
for properties sold on the six key lakes in our region was 48 days, more than double the 2017 median
of 23 days. On the Shadow Lake system, the median was 45 days in 2018 versus 28 days in 2017.
My explanation for this increase is that buyers from the GTA who had experienced a double-digit
percentage decline in their home values were expecting similar declines in cottage prices in 2018.
Cottage sellers on the other hand were not willing to reduce prices in line with GTA trends as a result
of their belief that “bubble” conditions were not evident in our market. This gap in pricing expectations
was resolved largely in favour of sellers, as evidenced by stable year-over-year prices.
- Other key takeaways from the 2018 market include:
- The selling season started very slowly in the western Kawarthas, but picked up momentum as the
season progressed. The post-September 1st market was very strong.
- Buyers almost uniformly desire to use their cottages year-round – if you have a three-season
property, it would be well worth your while to investigate the feasibility of enhancing it to four-
season capability.
- Looking forward, I am hoping that the strong momentum from the fall 2018 market will carry into 2019.
However, while the prospect of higher interest rates in 2019 appears to be receding, the late-2018
correction in financial markets has the potential to impact buyer demand for waterfront properties.
As always, real estate market conditions in the GTA will heavily influence our market.
Shadow Lake Market Value Update ~ October 15, 2018
Slow post-Labour Day market.
- There have been only two new listings and one sale in the September 1 to October 15th period, compared to five new listings and five sales in the same period last year. However, year-to-date listing and sales activity is in line with last year.
- The average sale price of the 17 properties sold to-date in 2018 is $500,000, down slightly from the average sale price of $521,000 for all Shadow Lake sales in 2017.
- The average Sale Price-to-MPAC Assessed Value ratio for the 17 sales so far this year is 1.47, slightly above the 1.40 ratio realized for all sales on Shadow Lake last year.
- Listings on the main body of Shadow Lake continue to be scarce.
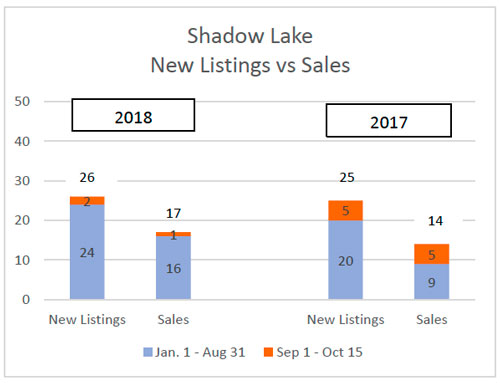
Shadow Lake Market Value Update ~ August 31, 2018
Listing and sales activity is up from last year and continue to be concentrated in the Gull River sections. Prices appear to be holding up well.
- August was a relatively slow month, with only one new listing and two sales.
- The average sale price of the 15 properties sold to-date in 2018 is $496,000, down from the average sale price of $521,000 for all Shadow Lake sales in 2017. This decline is largely attributable to the concentration of 2018 sales in the lower priced Gull River sections.
- The average Sale Price-to-MPAC Assessed Value ratio for the 15 sales so far this year is 1.48, slightly above the 1.40 ratio realized for all sales on Shadow Lake last year.
- Listings on the main body of Shadow Lake continue to be scarce.
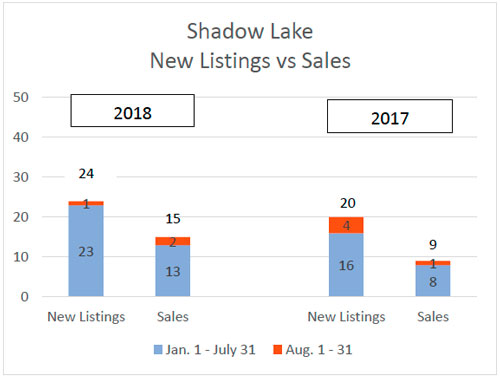
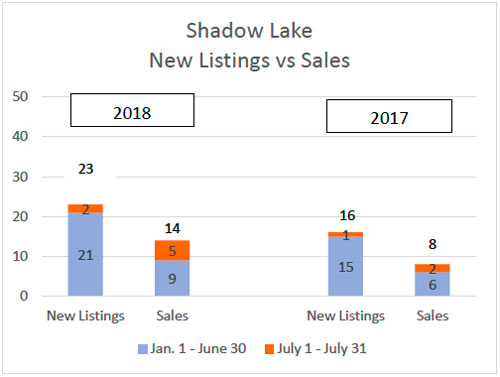
Shadow Lake Market Value Update ~ July 31, 2018
Sales so far this year continue to be concentrated in the Gull River sections. Prices appear to be holding up well.
- Both listing and sales activity in the first six months of 2018 are higher than the same period last year. This is a significant contrast to most of the other major lakes in our region. However, most of the sales in 2018 have been in the Gull River sections.
- The average sale price of the 14 properties sold to-date in 2018 is $484,000, down from the average sale price of $521,000 for all Shadow Lake sales in 2017. This decline is largely attributable to the concentration of the 2018 sales to-date in the Gull River sections.
- The average Sale Price-to-MPAC Assessed Value ratio for the 14 sales so far this year is 1.38, in line with the 1.40 ratio realized for all sales on Shadow Lake last year.
- There are currently ten active listings on Shadow Lake/Gull River, with an average Asking Price-to-MPAC Assessed Value ratio of 1.58.
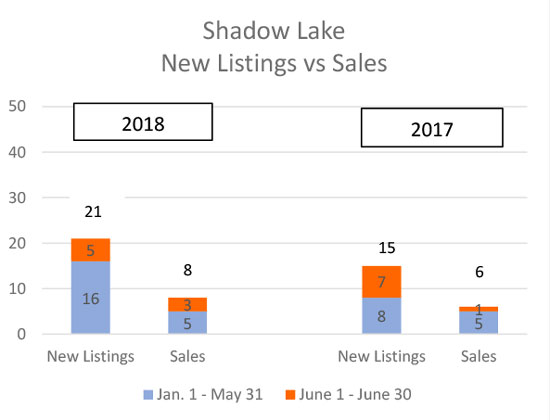
Shadow Lake Market Value Update ~ June 30, 2018
Sales so far this year continue to be concentrated in the Gull River sections. Prices appear to be holding up well.
- Both listing and sales activity in the first six months of 2018 are higher than the same period last year. This is a significant contrast to most of the other major lakes in our region. However, all but one of the sales in 2018 have been in the Gull River sections.
- The average sale price of the five properties sold to-date in 2018 is $424,000, down from the average sale price of $521,000 for all Shadow Lake sales in 2017. This decline is largely attributable to the concentration of the 2018 sales to-date in the Gull River sections.
- The average Sale Price-to-MPAC Assessed Value ratio for the eight sales so far this year is quite strong at 1.54, up from the 1.40 ratio realized for all sales on Shadow Lake last year.
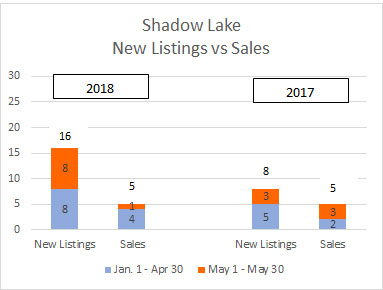
Shadow Lake Market Value Update ~ May 31, 2018
Sales so far this year have been concentrated in the Gull River sections. Prices appear to be holding up well.
- Since April 30, there have been eight new listings and one sales on the lake. Most of the new listing activity has occurred in the Gull River sections. On a year-to-date basis (Jan. 1/18 – May 18/18), listing activity has been double that of the same period last year, while sales totals are in line with last year.
- The average sale price of the five properties sold to-date in 2018 is $410,000, down from the average sale price of $518,000 for the five properties sold in the same time period last year, and the $521,000 average price for all Shadow Lake sales in 2017. This decline is largely attributable to the concentration of the 2018 sales to-date in the Gull River sections.
- The average Sale Price-to-MPAC Assessed Value ratio for the five sales so far this year is quite strong at 1.49, up from the 1.24 ratio realized on the five sales in the same period last year, and the 1.40 ratio realized for all sales on Shadow Lake last year.
- There is insufficient data to provide confidence of a upward trend in sales prices on Shadow Lake so far in 2018. However, the strong May results for Sturgeon Lake may provide some support – Sturgeon Lake trends tend to be a leading indicator of trends on other lakes in the region. Anecdotal evidence from our buyer agents that buyers are now coming out in much greater numbers also support the thought that the market may improve as we move into the summer months.
Shadow Lake Market Value Update ~ May 18, 2018
- Since April 30, there have been six new listings and no additional sales on the lake. On a year-to-date basis (Jan. 1/18 – May 18/18), total sales volume on the lake is $1.7 million, in line with the $1.6 million in sales for the same period last year.
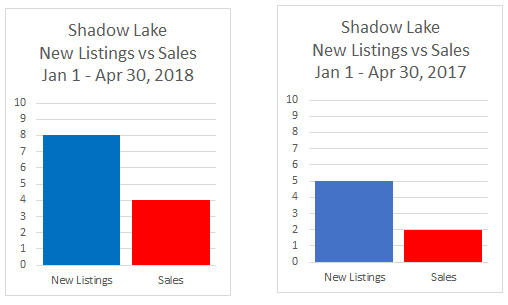
Shadow Lake Market Value Update ~ April 30, 2018
- The commentary below encompasses Shadow Lake, as well as Silver Lake, and the Gull River near Norland and above Coboconk.
- In contrast to other lakes in our region including Sturgeon and Balsam lakes, market activity on Shadow Lake is higher so far in 2018 compared to the same period last year. Since Jan. 1, 2018 there have been eight new listings and four sales. Last year during the same period there were five new listings and two sales. Consistent with last year, most new listings and sales have occurred on the Gull River, where winter ice cover is not an issue.
- The average sale price to assessed value ratio for the four sales in 2018 was 1.54, compared to the 1.40 ratio realized in 2017 (see summary below). Although the number of data points is insufficient to be definitive, this early evidence supports the theory that prices are holding up from last year. Anecdotal evidence from our buyer agents also indicates that there is a significant number of buyers wishing to purchase on Shadow Lake.
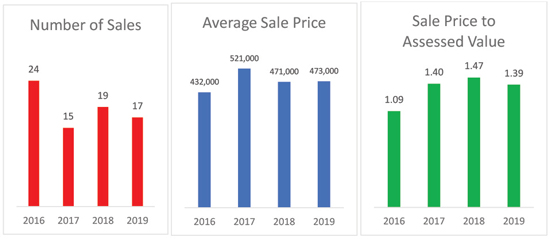
2017 Shadow Lake Summary
- The average sale price was $521,000 in 2017, up 21% from 2016.
- 15 properties were sold in 2017, down from the record high of 24 in 2016.
- Events in the GTA housing market influenced market dynamics on Shadow Lake (and all of the western Kawarthas) in 2017. The spring market was especially frothy, with large numbers of buyers competing for relatively few listings.
- Cottage buyer interest receded somewhat after the imposition of the foreign buyer tax in the GTA. Mid-priced cottages (up to $600,000) continued to sell quickly, however, while sales of higher priced properties slowed considerably.
- Listings on Shadow Lake were especially scarce due to the extended period of high water levels that stretched into early summer. The number of listings on the main body of Shadow Lake remained well below normal levels for the remainder of the season.
- In addition to the 21% year-over-year increase in average sale price, the trend to higher market values on Shadow Lake was supported by another metric we track closely – the Sale Price to Assessed Value Ratio. In 2017, the average ratio for all sales on Shadow Lake was 1.40, a 28% increase from the 1.09 ratio realized in 2016.
- Kawartha Waterfront Realty listed and sold the two highest priced properties on Shadow Lake in 2017. One of these sales in October 2017 set a record high sale price for Shadow Lake.